 OmniViz
 Features
Daily history
Harvest and consumption for every day, and a detailed view of any day with its curves and events.
Day after day
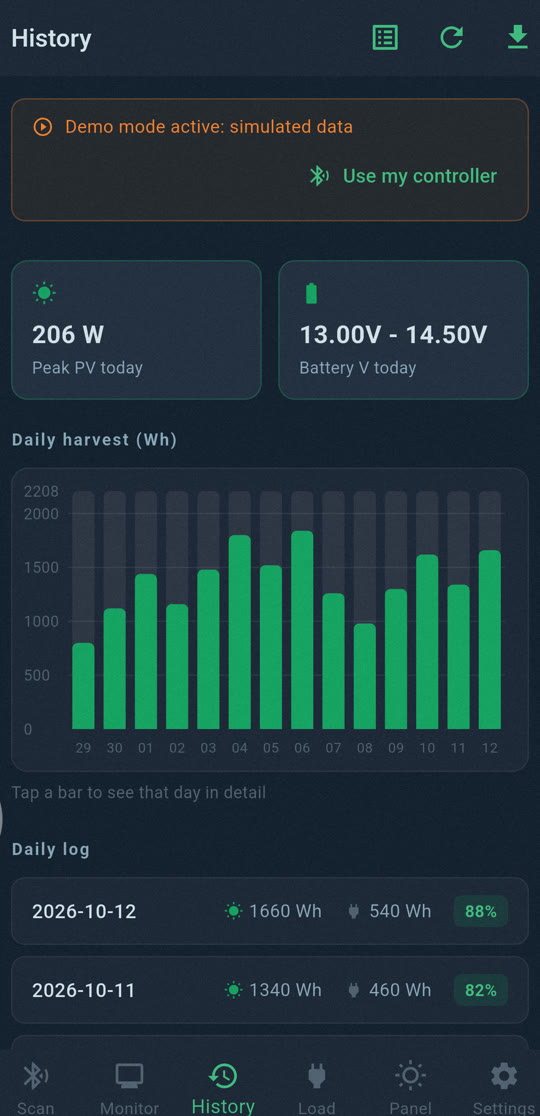
The History screen shows a bar chart of the energy your panels produced each day, with today's peak solar power and battery voltage range. You see at a glance which days were good and which were grey.
Tap a day to see it in detail
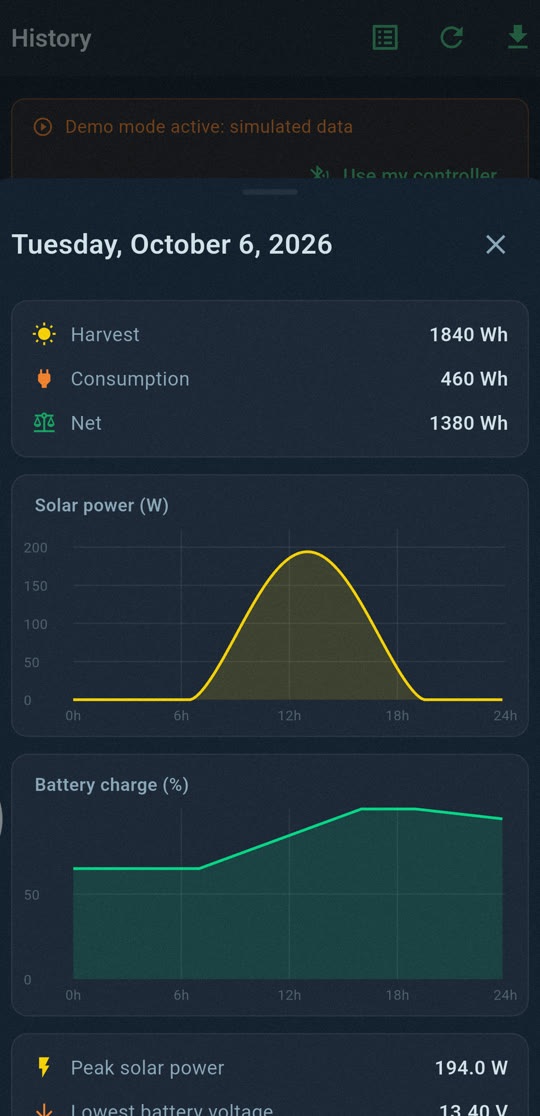
Tap any bar and the day opens in detail:
- energy harvested, used and the net balance;
- a curve of the solar power through the day, and one of the battery charge;
- the peak solar power, the lowest and highest battery voltage and charge;
- the day's events: load switched on or off, changes of charging stage, connections, low battery.
For the curious
In Expert mode you also get totals for the month, the year and all time, a list of every day, the full event log, and an export of all readings to a CSV file for a spreadsheet.
The app records while it is connected to your controller. Everything is stored on your phone, never in a cloud.